
In class, we’ve recently discussed various types of global networks containing giant components: social networks, computer networks, and economic networks. But one of the largest and most effective giant components is sitting right behind your eyes. The brain is the most connected network your body, and consequently the most complex. It’s estimated that the human brain has 100 billion neurons– more than 15 times the global population. Brains produce the most intricate of behaviors, but are composed of single units which are comparatively quite simple. So, the intelligence of the system is a product of the network that neurons are organized into.
Neuroscience has attempted to understand some of how data is processed and behaviors produced in the brain by isolating circuits within the neural network. But of course, while interesting, this is extremely limited. As demonstrated in class (1/28/08), the behavior of a group of three nodes can have implications for the entire network. If a triangle of nodes prefers to be “balanced,” then the global network will tend towards either a single cohesive group, or two separate groups.
Similarly, the connectivity of a single neuron has implications for the connectivity, and function, of the entire brain. The next step is to map the entire brain, as a complete network, and use this as a basis for our understanding.
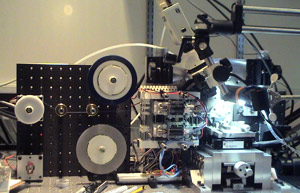
To the left is the ALTUM machine, which will automatically make thin slices of a mouse brain . A picture will then be taken, and the image sent to a computer which can compile a 3D image of the brain. This is part of a project by Jeff Lichtman, a professor at Harvard university. If the project is successful, a full scan of a mouse brain will contain petabytes of information– a scale at which Google servers operate on.
Complete brains have been mapped out before. A complete map of the 300 cell nervous system of C. elegans is commonly used in neuroscience research. But mapping out a mammalian brain such as that of the mouse, with whom we share a great deal of our genome, is considered by many to be the Human Genome Project of neuroscience.
 For more about the ALTUM machine and connectonomics, see the WIRED article on which this blog post is based.
Simply developing a “connectome” (connective map) of the neurons and synapses in the brain is not the end of the story for understanding the brain. How information is transmitted from one neuron to the next (in the form of an action potential) is much more than the existence of the physical connection. Neurons generally produce two types of signals: “excitatory” and “inhibitory.” We can of view these connections as positive and negative edges on a network. An excitatory signal can cause other neurons to fire an AP (action potential.) An inhibitory signal can prevent a connected neuron from firing.
Not all neurons are activated by one other neuron, either– some neurons require input from many neurons to fire. So edges are not only positive or negative, but weighted. Since these effects are mediated by the ion channels and receptors on a neuron, the chemicals it releases, and chemicals released by glands, a connectome will not give a picture of how the network actually functions. But still, it is both necessary and very neat first step.
Lepidoptera, an undergraduate in Neurobiology and Behavior, can be reached at lepidoptera@gmail.com with comments or complaints.

* You can follow any responses to this entry through the RSS 2.0 feed.