
While the subprime mortgage lending crisis has yet to be explained fully, as only time can tell the true causes and effects, a few simple models and an few intuitive observations can lend some valuable insight into why the crisis happened and how it cascaded. As reported here A guide to the subprime mortgage crisis Wall Street Journal or New York Times, the current lending crisis began when banks and other financial institutions extended loans, usually mortgages, to customers with sub-prime, or lower quality, credit ratings. These individuals had histories of late payments, defaults, lower wages, etc. Lenders loaned these riskier individuals money at lower rates on Adjustable Rate Mortgages (ARM’s) , or mortgages that had lower initial rates, but would reset to a market rate after a set period of time. In the past, these new rates were not significantly different than the initial rate because the market for these loans was generally stable, so lenders often pushed these loans over fixed rate loans to those who perhaps could not afford the slightly higher fixed rate. Some of these borrowers defaulted because clearly they were poor candidates for loans in the first place. The more people that defaulted, the less attractive the market for these loans, and the higher the interest rates reset to. Interest rates kept going up and more people were unable to make payments on their loans. Some people had the unfortunate experience of owing significantly more money than what their house was worth, in which case they would leave their house.
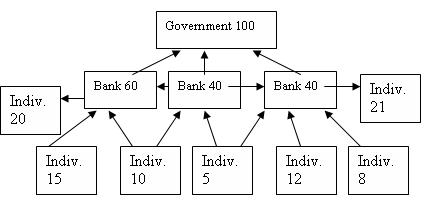 The most interesting part of this crisis is how it affected other areas of the credit / debt network. I made a simple network graph of banks, individuals, and government as nodes, and edges with the level of trust, or creditworthiness. Assume that all outward edges from a node have the same edge weight (creditworthiness). This number is displayed inside the node for ease. Creditworthiness is a score from 0 (no creditworthiness) to 100 (the most reliable). The direction of the arrows point toward where debt is owed. Before the credit crisis, the graph looked similar to the one pictured above. However, borrowers with low creditworthiness like the individual with creditworthiness=5, defaulted on their loans. When these people defaulted on their loans, rates increased for others, perhaps affecting those in the 5-10 group the most. When these rates went up, the 5-10 group defaulted, eliminating a total of half of the individual borrowers. The bank on the right who loaned two of these borrowers money has essentially lost a good chunk of money from defaulted loans. It now mandates that all individuals must have credit higher than 15, eliminating the individual with credit=12. This bank is hurting at this point, and the individual with credit = 21 might be inclined to withdraw his money from the bank, which is essentially a loan. This bank can only borrow money at this point from another bank, which is doubtful given its financial distress, or the government. In this situation, it can be argued that the government is the necessary stabilizing agent because it can easily print and lend more money at lower rates, within reason, to banks. Also, the government insures all loans made by individuals to banks up to a certain amount. These typically constitute bank accounts and CD accounts. Perhaps with this insurance, the individual with credit=21 might have kept his money in the right-hand bank. It can also be seen that as the situation progresses, less and less money is lent, which can lead to slowed economic activity due to less available credit. Businesses that may need a loan for improvements might have a problem attaining a loan. While the current crisis is much more complex, involving many more institutions and inputs, some deductions can be made through simple network modeling.

* You can follow any responses to this entry through the RSS 2.0 feed.