
We recently focused on simple tipping phenomena. Typically, these models involve a strictly increasing function, where the number of people attending rises with people expected to attend. However, what if, at some point, additional forces cause this function to begin to decrease - congestion costs, for example?
(Much of the mathematics behind this is based upon my own research in high school, and I can provide my old paper if one wishes. I have made several programs exploring this sort of dynamic in a mathematical context. This is a new application of that research.)
The new situation can be modeled as follows:
The first time some recurrent event happens, some initial number of people attend.
Suppose x people attend the event. With only this information about previous attendances, f(x) people would want to attend the event the next time it happens. The simplest way to interpret this is that x people attended last time, so everyone uses only that information to determine whether they attend this time. f(x) is then in fact a smooth function of x. (However, f(x) can end up needing to take outside considerations into account. A variant could let f(x) consider multiple previous values of x - which could model decisions depending on whether the trend is increasing, for example - but this becomes much harder to analyze using the tools I will briefly introduce.)
The simplest model would probably be a parabola that is zero at x = 0 and again at x = 1, and peaks halfway. So let f(x) = ax(1-x), where a is some parameter. The function peaks at f(0.5) = 0.25a. The parameter a represents a sort of popularity - if things are just right between crowded and sparse, how many people would maximally show up?
Here’s a diagram of what sort of thing happens, for a = 2:
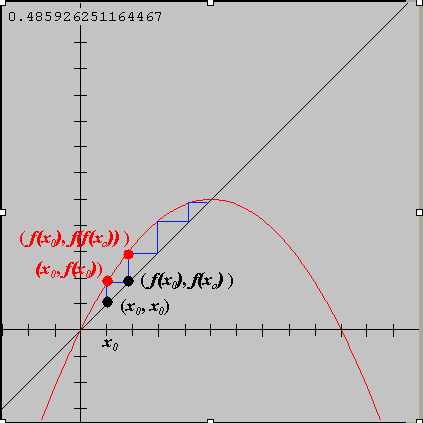
Above, we picked a random initial value x_0, and then iterated as shown. Graphically, drawing up to the function evaluates the function at our current x, and drawing across to the diagonal updates the x value to the next x.
Want to see and explore these for yourself? I would recommend Winfeed, from http://math.exeter.edu/rparris/winfeed.html (click link at the title near the top). Download it, run it, and choose to make a new web diagram (you might have to change the function to the logistic option.)
Now we use lots of different a and plot the resulting value(s) when things get stable. The surprisingly-interesting result is called the Feigenbaum diagram. (The variable a is labeled r in the following version.)

So things don’t always reach stability! Why?
Well, first, analyze the the left side. At values less than 2, less than half the max ever wants to go, so there is very little interesting behavior - if there are too many, the population immediately shrinks to less than half. Then there is no longer crowding and attendance grows slowly until it reaches equilibrium.
Beyond 2, the equilibrium happens past the halfway mark, where the function peaks. The slope is negative at the equilibrium - if more people come, the next attendance drops below the equilibrium, and the reverse is true (if attendance is a little below, more than the equilibrium come). Values oscillate around the stable value until it converges there: too many come, then too few, then only slightly too many, and only slightly too few, so on. On web diagram, the values seem to spiral into the middle of the diagram.
But what’s with the fork? Well, eventually the slope around the point becomes too negative and it no longer converges - a small change in x creates an even greater change in the next step, and things diverge away from the equilibrium. But it manages to then find an “orbit” of period 2 - if you solve the function taking steps 2 at a time, you end up with the solutions of those two branches. But as you keep increasing a, this happens again, and again, and again… And you get orbits of 2, 4, 8, 16, 32….
And then at one point, things fall apart completely! Chaos reigns the region beyond about 3.7, with occasional scatterings of periods of other numbers (such as 3, which is the big “window”). The diagram is in fact a fractal - if you zoom in repeatedly, there are little pieces that are almost identical to the overall picture.
I’m just introducing this topic, so I won’t cover the math behind all these different phenomena in detail (I may choose to flesh this out in the short paper). But they all occur with this same simple model!
What does it mean? My interpretation is that as peak popularity and desirability increases (but congestion factors continue to apply), volitilitiy and chaos increases. (As real-world systems usually don’t follow a model exactly, it would be unlikely that something would hold the same a value to hit and stay in the period-3 window, for example.)
An actual example of such behavior, I’ve heard anecdotally, is the periodic swing in the population of locusts.
But one might object that this chaos is not actually observed. The usage of capacity that describes of the NY mass transit system at rush hour probably needs a value of a greater than the chaos point of 3.7ish. If a subway is about half-full, more might be willing to ride, but then when a subway crowds, the model drops riders’ willingness much too sharply. The actual behavior is not this chaotic day-to-day. However, I would argue that there is a time lag here which dampens possible underlying chaos. It is not true that all people re-evaluate their decision to use mass transit on an everyday scale, so there can be a much more gradual decrease in ridership. Also, people take into account the trend of ridership, so if it seems that other people on a too-crowded line are not riding as much anymore, they might be more willing to continue riding and wait it out, which adds additional damping and prevents chaotic overshoot.
Another cautionary example: Although, for example, Yankees attendance might seem to follow model which should end up chaotic, the demand for their tickets greatly outstrips the available supply. Therefore, not all the people who want to attend actually do so. The expected number of people attending the next game would become equal to the capacity of the stadium, not the number of people who wanted to attend. Therefore, there would be an equilibrium stuck on the capacity of the stadium. The proper way to model to set the capacity of the stadium to 1, and then let f(x) rise until it hits 1 and then stay there.

* You can follow any responses to this entry through the RSS 2.0 feed.