
Did you know that Anchorage, Alaska, experiences approximately 19 hours of daylight on the summer solstice? Or that in Barrow, Alaska, the sun does not set for 84 continuous days during the summer (approximately May 10-August 2)?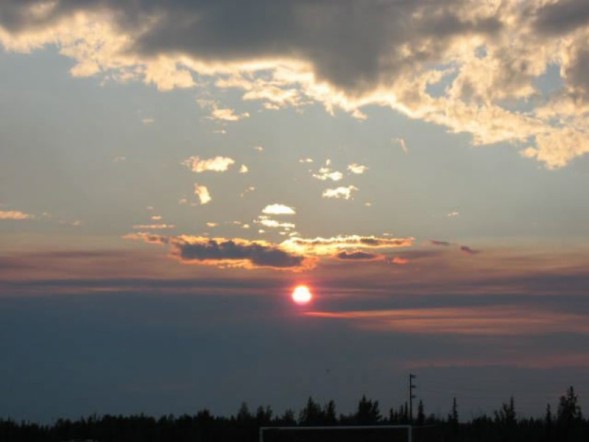
Did you know that summer temperatures in Fairbanks, Alaska, can reach 100+ degrees Fahrenheit? Or that Alaska’s short but intense growing season can produce giant vegetables such as cabbages weighing over 100 pounds and pumpkins weighing over 1,000 pounds?
Many people think of Alaska (and the entire Arctic region) as a place of cold, snow, and darkness. And for a portion of the year, that is true. On the winter solstice (Dec. 21), Anchorage experiences about 5 hours of daylight. Residents of Barrow say goodbye to the sun on Nov 18. They won’t see the sun rise again until January 22!
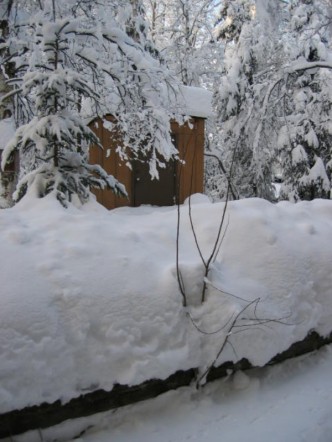 While temperatures tend to be milder in Anchorage due to the coastal location, winter temperatures in Alaska’s interior can drop to 40 degrees below zero. Brr!
Seemingly endless sunlit days in summer and winter nights that never end, Alaska and the entire Arctic region experience huge fluctuations in seasonal amounts of daylight and temperature. Teaching about these extremes can help your students understand the cause of seasons.
Why teach about seasons?
The cause of our Earth’s seasons is the subject of many misconceptions. Research has shown that even some college graduates and teachers were unable to correctly identify the cause of seasonal change. The National Science Digital Library’s Middle School Portal provides more information about these misconceptions.
The most common misconception is that earth is closer to the sun during the summer and farther away during winter months. Science U’s observatory page includes a discussion of this misconception and why it isn’t correct.
So why do we have seasons? It all comes down to the earth’s axis.
Earth’s tilted axis means that as the earth revolves around the sun, the northern and southern hemispheres receive more direct sunlight at different times of the year. More direct sunlight leads to higher temperatures, resulting in summer for that part of the world.
The cause of seasonal change is listed in the National Science Education Standards as an Earth and Space Science content standard for grades 5-8. However, it is recommended that students in K-4 develop their observational and descriptive skills. Comparing and contrasting seasonal amounts of daylight and temperature between the student’s home and a location in the Arctic will build the necessary foundation for this difficult concept. These concepts also tie nicely into a study of geography and climate, which is often part of elementary social studies curricula. (Read the entire National Science Education Standards online for free or register to download the free PDF. The content standards are found in Chapter 6.)
Teaching the Science
Two online articles from NSTA’s Science and Children journal show how to integrate literacy and the science of the seasons. All lessons use trade books to introduce a concept that is further developed through inquiry activities. To access these free articles, you will first need to log in to the NSTA web site. Creating an online account with NSTA is free.
In “Seasons by the Sun “, students in K-3 read Sunshine Makes the Seasons and then trace and measure their shadows seasonally. Teachers can lead their students to reflect on and compare their observations. Students in grades 4-6 read Arctic Lights, Arctic Nights and record data from the story on a data sheet. Follow-up discussion and activities allow students to represent data graphically and begin to understand the connection between the seasons and day length. Students can then extend their understanding by collecting and graphing information for their hometown.
In “A Season to Inquire“, students in K-3 read Four Seasons Make a Year. They then draw a schoolyard scene repeatedly through the year, measuring shadow lengths, comparing observations, and making predictions and connections with each new observation. Students in grades 4-6 read Autumn (Winter & Spring) Across America, a three-book series by Seymour Simon. Students then investigate changes in temperature as a flashlight is held at different angles. The observed pattern, that direct light results in greater temperatures, can help students begin to explain the change in seasons and the difference between temperatures in their hometown and other locations.
The U.S. Naval Observatory web site can compute a sunrise/sunset table for any location worldwide for a one-year period. The table itself isn’t kid-friendly, but it does provide an excellent data source for teachers wanting to compare seasonal changes for a variety of locations.
Suggested Readings
These titles are incorporated into the “Seasons by the Sun” and “A Season to Inquire” lessons mentioned above. You may have other exemplary books in your own library, or your media specialist may be able to recommend titles.
Sunshine Makes the Seasons. Franklyn M. Branley. Illustrated by Michael Rex. HarperCollins. 2005. 31 pp. Recommended Ages: Primary.
Four Seasons Make a Year. Anne Rockwell. Illustrated by Megan Halsey. Walker & Company. 2004. 32 pp. Recommended Ages: Primary.
Arctic Lights, Arctic Nights. Debbie S. Miller. Illustrated by Jon Van Zyle. Walker Publishing. 2003. (Unpaged). NSTA Outstanding Trade Book (2004). Recommended Ages: Elementary.
Autumn Across America. Seymour Simon. Hyperion. 1993. 32 pp. Recommended Ages: Elementary.
Winter Across America. Seymour Simon. Hyperion. 1994. 32 pp. Recommended Ages: Elementary.
Spring Across America. Seymour Simon. Hyperion. 1996. 32 pp. Recommended Ages: Elementary.
Literacy Connection
The NSTA resources provided above incorporate many valuable literacy skills. Reading and discussing quality trade books expose students to scientific content and expository text. These books provide a great opportunity for reading comprehension activities and vocabulary development. Furthermore, the journaling and observational activities that follow each book require students to write and discuss their ideas with peers and teachers.
Back to You!
What about you? Do you have a favorite resource, lesson plan, or book that you’d like to share? What about exemplary student work (without identifying information, of course)? This site won’t be at its best unless we have input from you — the people who make these ideas come alive to your students everyday! Please post a comment to this blog with suggestions, tips, or comments.
And of course, please check back often for our newest post, download the RSS feed for this blog, or request email notification when new content is posted (see right navigation bar). We’ll alternate these longer posts with shorter posts called “Polar News & Notes.” Instead of providing lessons and activities for your classroom, “Polar News & Notes” posts are designed for you - a chance to learn and reflect.
That’s all for now! Until next time, stay cool with this hot topic!
 Follow us on Twitter


[…] story here Der Beitrag wurde am Tuesday, den 13. November 2007 um 13:40 Uhr veröffentlicht und wurde […]
[…] here for full […]
NSTA also features a set of daytime astronomy lessons called Astronomy with a Stick, which explore the reasons for the seasons using graphing and modeling activities. The “Stick” in the title refers to a gnomon, which casts a shadow that students use to measure solar noon and create a compass rose to determine true north.
Great information and books. I will use some of them when I teach a weather /season unit in second grade. I also have the students choose a tree the first day of school (Aug) and we draw it and make observations such as the temperature, shadow of the tree, time of day etc. We revisit the same tree in the fall, winter, and spring.
The National Climatic Data Center offers a nice clickable map of weather extremes:
http://www.ncdc.noaa.gov/oa/climate/globalextremes.html
Teachers can also download files of local climate data for free. This information would be useful for teachers who want to insert real data into lessons or activities they develop. Choose the state, and then the local/regional area. If you want to compare the months (seasons), request the annual summary for a year (following the 12th monthly report for that year). It opens as an 8-page document. The first page has three plotted graphs (max and min temperatures, daily precipitation, and daily station pressure). The seventh page has a narrative/text description of the climate factors for that location. You can save the entire file, or print selected pages.
http://www7.ncdc.noaa.gov/IPS/LCDPubs?action=getstate