Community:StrandMaps/Training/Tutorial Basic
From NSDLWiki
Contents[hide] |
Strand Maps Service Basic Tutorial
This tutorial will show you how to develop your own basic Science Literacy Maps user interface for your website that display several features that are provided with the Strandmaps API including: common student misconceptions, National Science Education Standards and access to all available maps in an interactive display. View a Demo
Requirements
To proceed with this tutorial, you will need:
- Familiarity with the NSDL Science Literacy Maps user interface
- Familiarity with the SMS JavaScript API documentation
- Basic programming skills in JavaScript, HTML, and CSS
- Web space to host your new user interface.
Step 1: Create your directory structure
Create a project folder in your development environment to contain your files. Within this folder, create the following hierarchy of folders.
- main SMS directory
- styles
- scripts
Create a new HTML file and save it as index.html in your main SMS directory. Add the following snippet to the HEAD section.
<script type="text/javascript" src="http://strandmaps.nsdl.org/cms1-2/jsapi/maps?api=v1"></script>
This snippet includes the SMS API in your project.
Step 2: Create your basic page layout
Copy and Paste the following markup into the body of your index.html file.
<div id="customHeader"></div>
<div id="contentArea">
 <div id="strandSelector"></div>
 <div id="strandMap"></div>
 <div id="defaultContent" style="display:none;"></div>
</div>
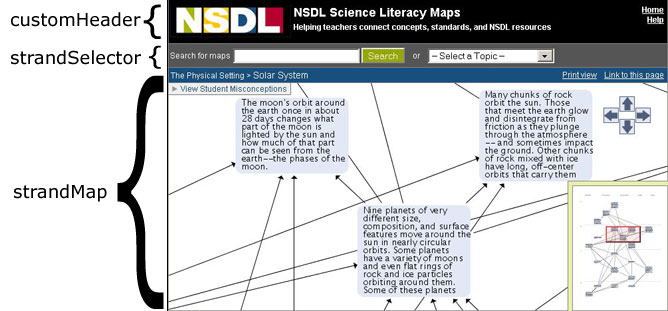
This snippet contains five div tags with the following IDs.
customHeader
container that holds the user interface's header section and typically contains branding information such as your logo and website name.
contentArea
container that holds all page markup elements outside of the customHeaderstrandSelector
container for the default search and browse functionality. This element is provided by the API and includes browsing access to all available maps. If you would like to provide limited access to specific maps only, you can create your own strand selector and not include thisstrandMap
container that displays the interactive maps. This element can be customized further by including several attributes to change default colors and dimensions. These attributes are discussed later in this tutorial.
defaultContent
controls what text and images are displayed to the user when they first view your map browser and before a map has been selected to view. This element contains a display:none style to force the default content to stay hidden when the user is viewing maps.
Step 3: Create your stylesheet
Save the default stylesheet to your SMS project's styles directory and add the following line to your HTML's HEAD element.
<link href="styles/styles.css" rel="stylesheet" type="text/css" />
This stylesheet contains several styles for a basic map browser. Feel free to experiment with the provided styles and adjust colors as needed to fit your branding scheme.
index.html file in a browser. It should contain an empty customHeader, an empty defaultContent area, and contain the default search and browse capabilities within the strandSelector area.
Feel free to add some introductory HTML to the customHeader and empty defaultContent elements and view your index.html file again to make sure your header and default content displays.
At this stage, you should be able to search and browse for maps, but you won't be able to view any content in the infoBubble.
Step 4: Create your JavaScript
Create a new file and save it as scripts.js in your project's scripts directory.
Add the following snippet to your HTML's HEAD element.
<script type="text/javascript" src="scripts/scripts.js"></script>
4.a: Basic set-up
Copy and paste the following snippet to your scripts.js file.
SMSEvent.addListener(StrandMap,"onload", setUpStrandMap);
 function setUpStrandMap() {
}
This creates a JavaScript listener that calls the setUpStrandMap function when the Strand Maps initially load. Within the setUpStrandMap function, you can provide addition instructions, such as how your user interface should handle clicks on the infoBubble and what elements to display.
4.b: Display student misconception research
Student misconceptions information is disabled by default. To provide this information, copy and paste the following snippet into your setUpStrandMap function.
StrandMap.enableMisconceptions(true);
If you view a map that contains student misconception research, such as the Physical Setting > Solar System map, the research will be available via a link in the upper left part of the strandMap element.
4.c: Define benchmark click functionality
Copy and paste the following snippet into your setUpStrandMap function.
infoBubble = StrandMap.getInfoBubble();
SMSEvent.addListener(StrandMap,"onbenchmarkselect",onBenchmarkSelect);
This snippet sets up a handler that calls the onBenchmarkSelect function when any benchmark is clicked.
Create a new function called onBenchmarkSelect and copy and paste the following snippet into that function.
infoBubble.setTitle("Benchmark Details");
infoBubble.setBuiltinContent("benchmarkdetails");
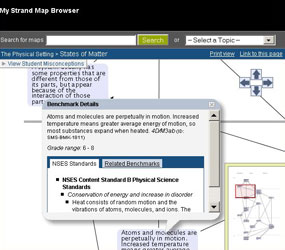
This snippet sets the infoBubble's title to Benchmark Details, and populates the bubble with built-in content provided by the API. The parameter benchmarkdetails displays the full text of benchmark with NSES standards in the infoBubble.
If you click on any benchmark within a map, the infoBubble will open and you can view the full text of the benchmark, associated grade range, and associated NSES standards, if any.
Step 5. Additional features
Within this basic user interface, there are some additional features you can define using the SMS API.
Option 1: Change the colors used in the interactive maps
To change the color of the map boxes within the interactive maps add the following snippet to the strandMap <div> in your index.html file.
mapColor="#E6E6FA"
The value of the mapColor attribute can be changed to any HTML color defined by hexadecimal notation or text (for example: #E6E6FA or lavender).
To change the color of the mouse hover highlight around the map boxes add the following snippet to the strandMap <div> in your index.html file.
highlightColor="plum"
The value of the highlightColor attribute can be changed to any HTML color defined by hexadecimal notation or text (for example: #FFFF00 or yellow).
Option 2: Change the height and width of the interactive maps
If not specified, the interactive map will resize itself to fit the maximum height and width of the browser window. To define specific dimensions for the maps, add the following snippet to the strandMap <div> in your index.html file.
mapHeight="500" mapWidth="900"
The value of the mapHeight and mapWidth can be changed to any dimensions that works for your user interface. Units are in pixels.
Option 3: Adjust the size of the infoBubble
Since the infoBubble is only displaying basic information about the benchmark and does not include tab, you can minimize the size of the bubble by adding the following snippet to your your setUpStrandMap function within your scripts.js file. view plaincopy to clipboardprint?
infoBubble.setMaxSize(375,350);
This snippet will limit the infoBubble to 375 pixels wide by 300 pixels high. You can change these values to whatever works best for your user interface.
Option 4: Alternate displays for the the NSES standards
If you want to display the NSES standards within a tab or not display them at all, you can rewrite your onBenchmarkSelect function within your scripts.js file as follows.
FROM
infoBubble.setBuiltinContent("benchmarkdetails");
TO
infoBubble.setBuiltinContent("benchmarkonly");
The parameter benchmarkonly displays only the full text of benchmark and associated grade range in the infoBubble.
To display the NSES standards in a tab add the following snippet to your setUpStrandMap function.
infoBubble.addBuiltinTab("nses","NSES Standards");
NOTE: Tabs will display in the order that that are created.
Option 5: Display related benchmarks
The ability to provide related benchmarks in a tab is provided by the API. To enable this feature, add the following snippet to your setUpStrandMap function within your scripts.js.
infoBubble.addBuiltinTab("relatedbenchmarks","Related Benchmarks");
Although we've enable the ability to view related benchmarks, we must explicitly click the Related Benchmarks tab to see them after we've clicked on a benchmark. To automatically select this tab when a a benchmark is clicked, add the following snippet to your onBenchmarkSelect function within your scripts.js.
infoBubble.selectTab(_bmTab);
Final code
Your scripts.js file should now look similar to this:
SMSEvent.addListener(StrandMap,"onload", setUpStrandMap);
function setUpStrandMap() {
 StrandMap.enableMisconceptions(true);
 infoBubble = StrandMap.getInfoBubble();
 SMSEvent.addListener(StrandMap,"onbenchmarkselect",onBenchmarkSelect);
 infoBubble.setMaxSize(375,350);
 infoBubble.addBuiltinTab("nses","NSES Standards");
 infoBubble.addBuiltinTab("relatedbenchmarks","Related Benchmarks");
}
function onBenchmarkSelect() {
 infoBubble.setTitle("Benchmark Details");
 infoBubble.setBuiltinContent("benchmarkonly");
 infoBubble.selectTab(_bmTab);
}
Your index.html file should now look similar to this:
<html>
 <head>
   <title>My SMS</title>
   <script type="text/javascript" src="http://strandmaps.nsdl.org/cms1-2/jsapi/maps?api=v1"></script>
   <link href="styles/styles.css" rel="stylesheet" type="text/css">
   <script type="text/javascript" src="scripts/scripts.js"></script>
 </head>
 <body>
   <div id="customHeader">My SMS</div>
   <div id="contentArea">
     <div id="strandSelector"></div>
     <div id="strandMap" mapColor="#E6E6FA" highlightColor="plum" mapHeight="500" mapWidth="900"></div>
     <div id="defaultContent" style="display:none;">Welcome to My SMS </div>
   </div>
 </body>
</html>
Download the files for this tutorial.


